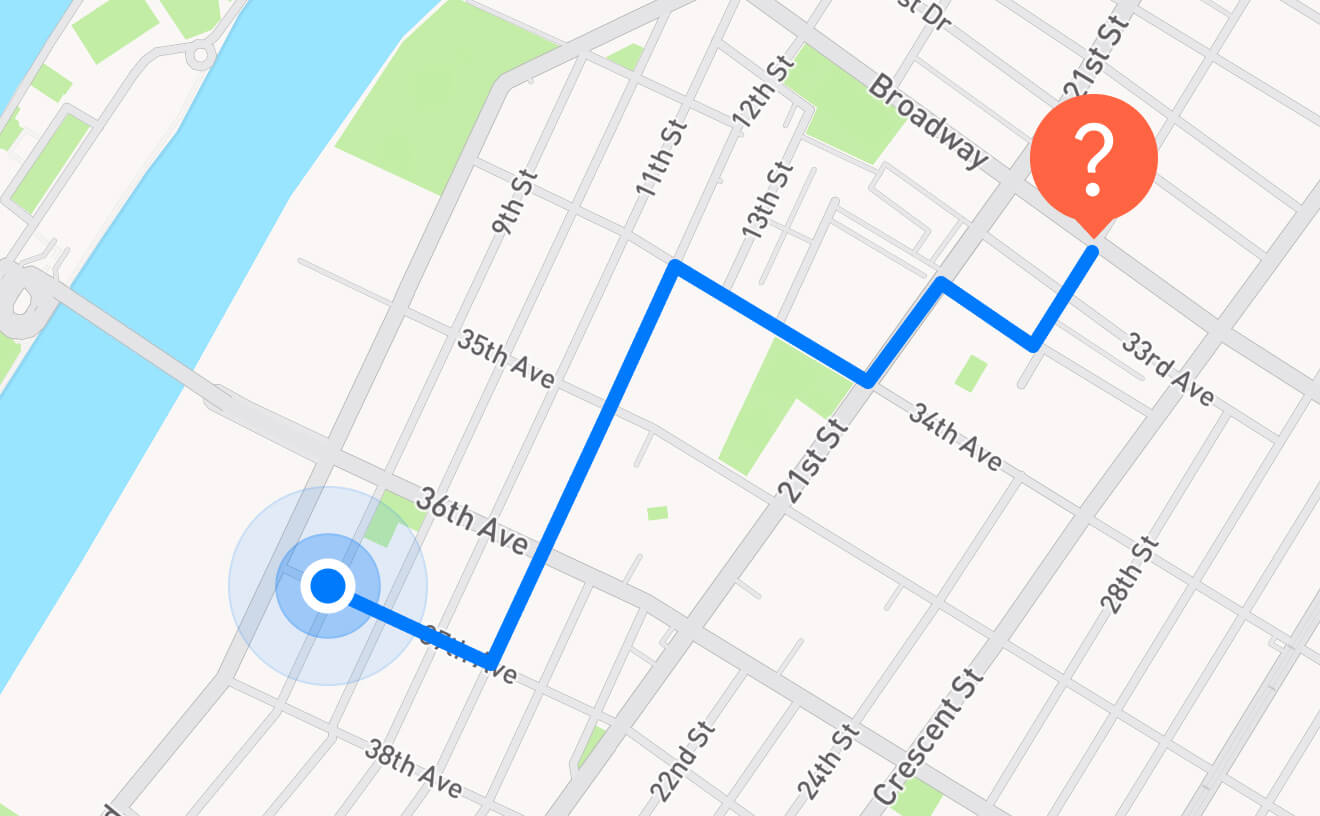
Wires 6: Drawing The Map [Frontend]

You read it right, there is no dought this is going to be a nightmare for me but anyways I am going to do my best.
Structure the map
It’s important to know how to sturcture the map so that traversing it would be easy, I have choosen the simplest way to represent the map as a 2D array!
Having a well defined map structure will later on descide how are we going to build the API! and also have great impact on performance.
[
    0, 1, 1, 1, 0, 0, 0
    0, 1, 1, 1, 1, 1, 0
    0, 0, 0, 1, 0, 0, 0
    1, 1, 1, 0, 0, 1, 1
    1, 0, 1, 0, 1, 0, 0
]- Zeros mean you can visit, otherwise obstacles (Simple!)
Generating the map
Let’s face it, I suck at Frontend so I don’t expect to build the prettiest map!
I will be creating the map manually using JS and HMTL.
- Let’s start with the map as empty 2D array with zeros.
const size = 1000;
const gridCount = 100;
const squareSize = size / gridCount;

// create an array of zeros with the size of the map
const gridMap = new Array(gridCount)
  .fill(0)
.map(() => Array(gridCount).fill(0));- Create an SVG to draw in it
const svg = document.createElementNS("http://www.w3.org/2000/svg", "svg");
svg.setAttribute("width", size);
svg.setAttribute("height", size);
svg.setAttribute("viewBox", `0 0 ${size} ${size}`);
svg.setAttribute("style", "border: 1px solid black;");- Appending the rects to the SVG rect represents the block in the map aka pixel
// add all the rects inside the svg
for (let x = 0; x < gridCount; x++) {
  for (let y = 0; y < gridCount; y++) {
    const rect = document.createElementNS("http://www.w3.org/2000/svg", "rect");

    // save the rect in the points object
    points[`${x},${y}`] = rect;
    rect.setAttribute("width", squareSize + squareSize / 2);
    rect.setAttribute("height", squareSize + squareSize / 2);
    rect.setAttribute("x", x * squareSize - squareSize / 2);
    rect.setAttribute("y", y * squareSize - squareSize / 2);
    rect.setAttribute("fill", "white");

    rect.addEventListener("click", () => draw(x, y));

    svg.appendChild(rect);
  }
}- Draw function To make the map attractive I have colors for pixels:
- White for streets (Non-obstacle)
- Blue for water (Obstacle)
- Green for land (Obstacle)
- Gray/Orange for blocks (Obstacle)
const draw = (() => {
  let count = 0;
  let minX = (maxX = minY = maxY = null);
  const allPoints = [];

  // a function to highlight the selected cells
  const highlight = () => {
    for (let x = minX; x <= maxX; x++) {
      for (let y = minY; y <= maxY; y++) {
        const rect = points[`${x},${y}`];
        rect.setAttribute("fill", currentColor);
      }
    }
  };

  return (x, y) => {
    count++;

    if (!minX || minX > x) minX = x;
    if (!maxX || maxX < x) maxX = x;
    if (!minY || minY > y) minY = y;
    if (!maxY || maxY < y) maxY = y;

    highlight();

    // mark the location
    gridMap[y][x] = {
      color: currentColor,
    };
    minX = maxX = minY = maxY = null;
  };
})();
Map Data
The exported map will look like this:
const beautifulMap = [
  [
    0,
    0,
    { color: "#d77a61" },
    0,
    0,
    { color: "#d77a61" },
    { color: "#d77a61" },
    0,
    { color: "#62a0ea" },
    0,
    0,
    0,
    { color: "#d77a61" },
    { color: "#d77a61" },
    0,
    { color: "#d77a61" },
    { color: "#d77a61" },
    0,
    0,
    { color: "#d77a61" },
    0,
    0,
    0,
    { color: "#57e389" },
    { color: "#57e389" },
  ],
...
]
The actual map

Q/A
-
Why not just using google maps ? Well, I like to make things from scratch first then I might use gmaps or others.
-
It’s really tedious to create the map by hand ? Yes, I first thought about generating the map using some algorithm (mapgen), maybe later.
Say Hello :D
Sponsor